Contact Us
If you have made it this far, you are here with a reason. You need our help! We are super friendly and genuinely care to help you succeed.
Enquire today to receive a FREE consultation with an App Guru.
Get in Touch
info [at] appgurus.com.au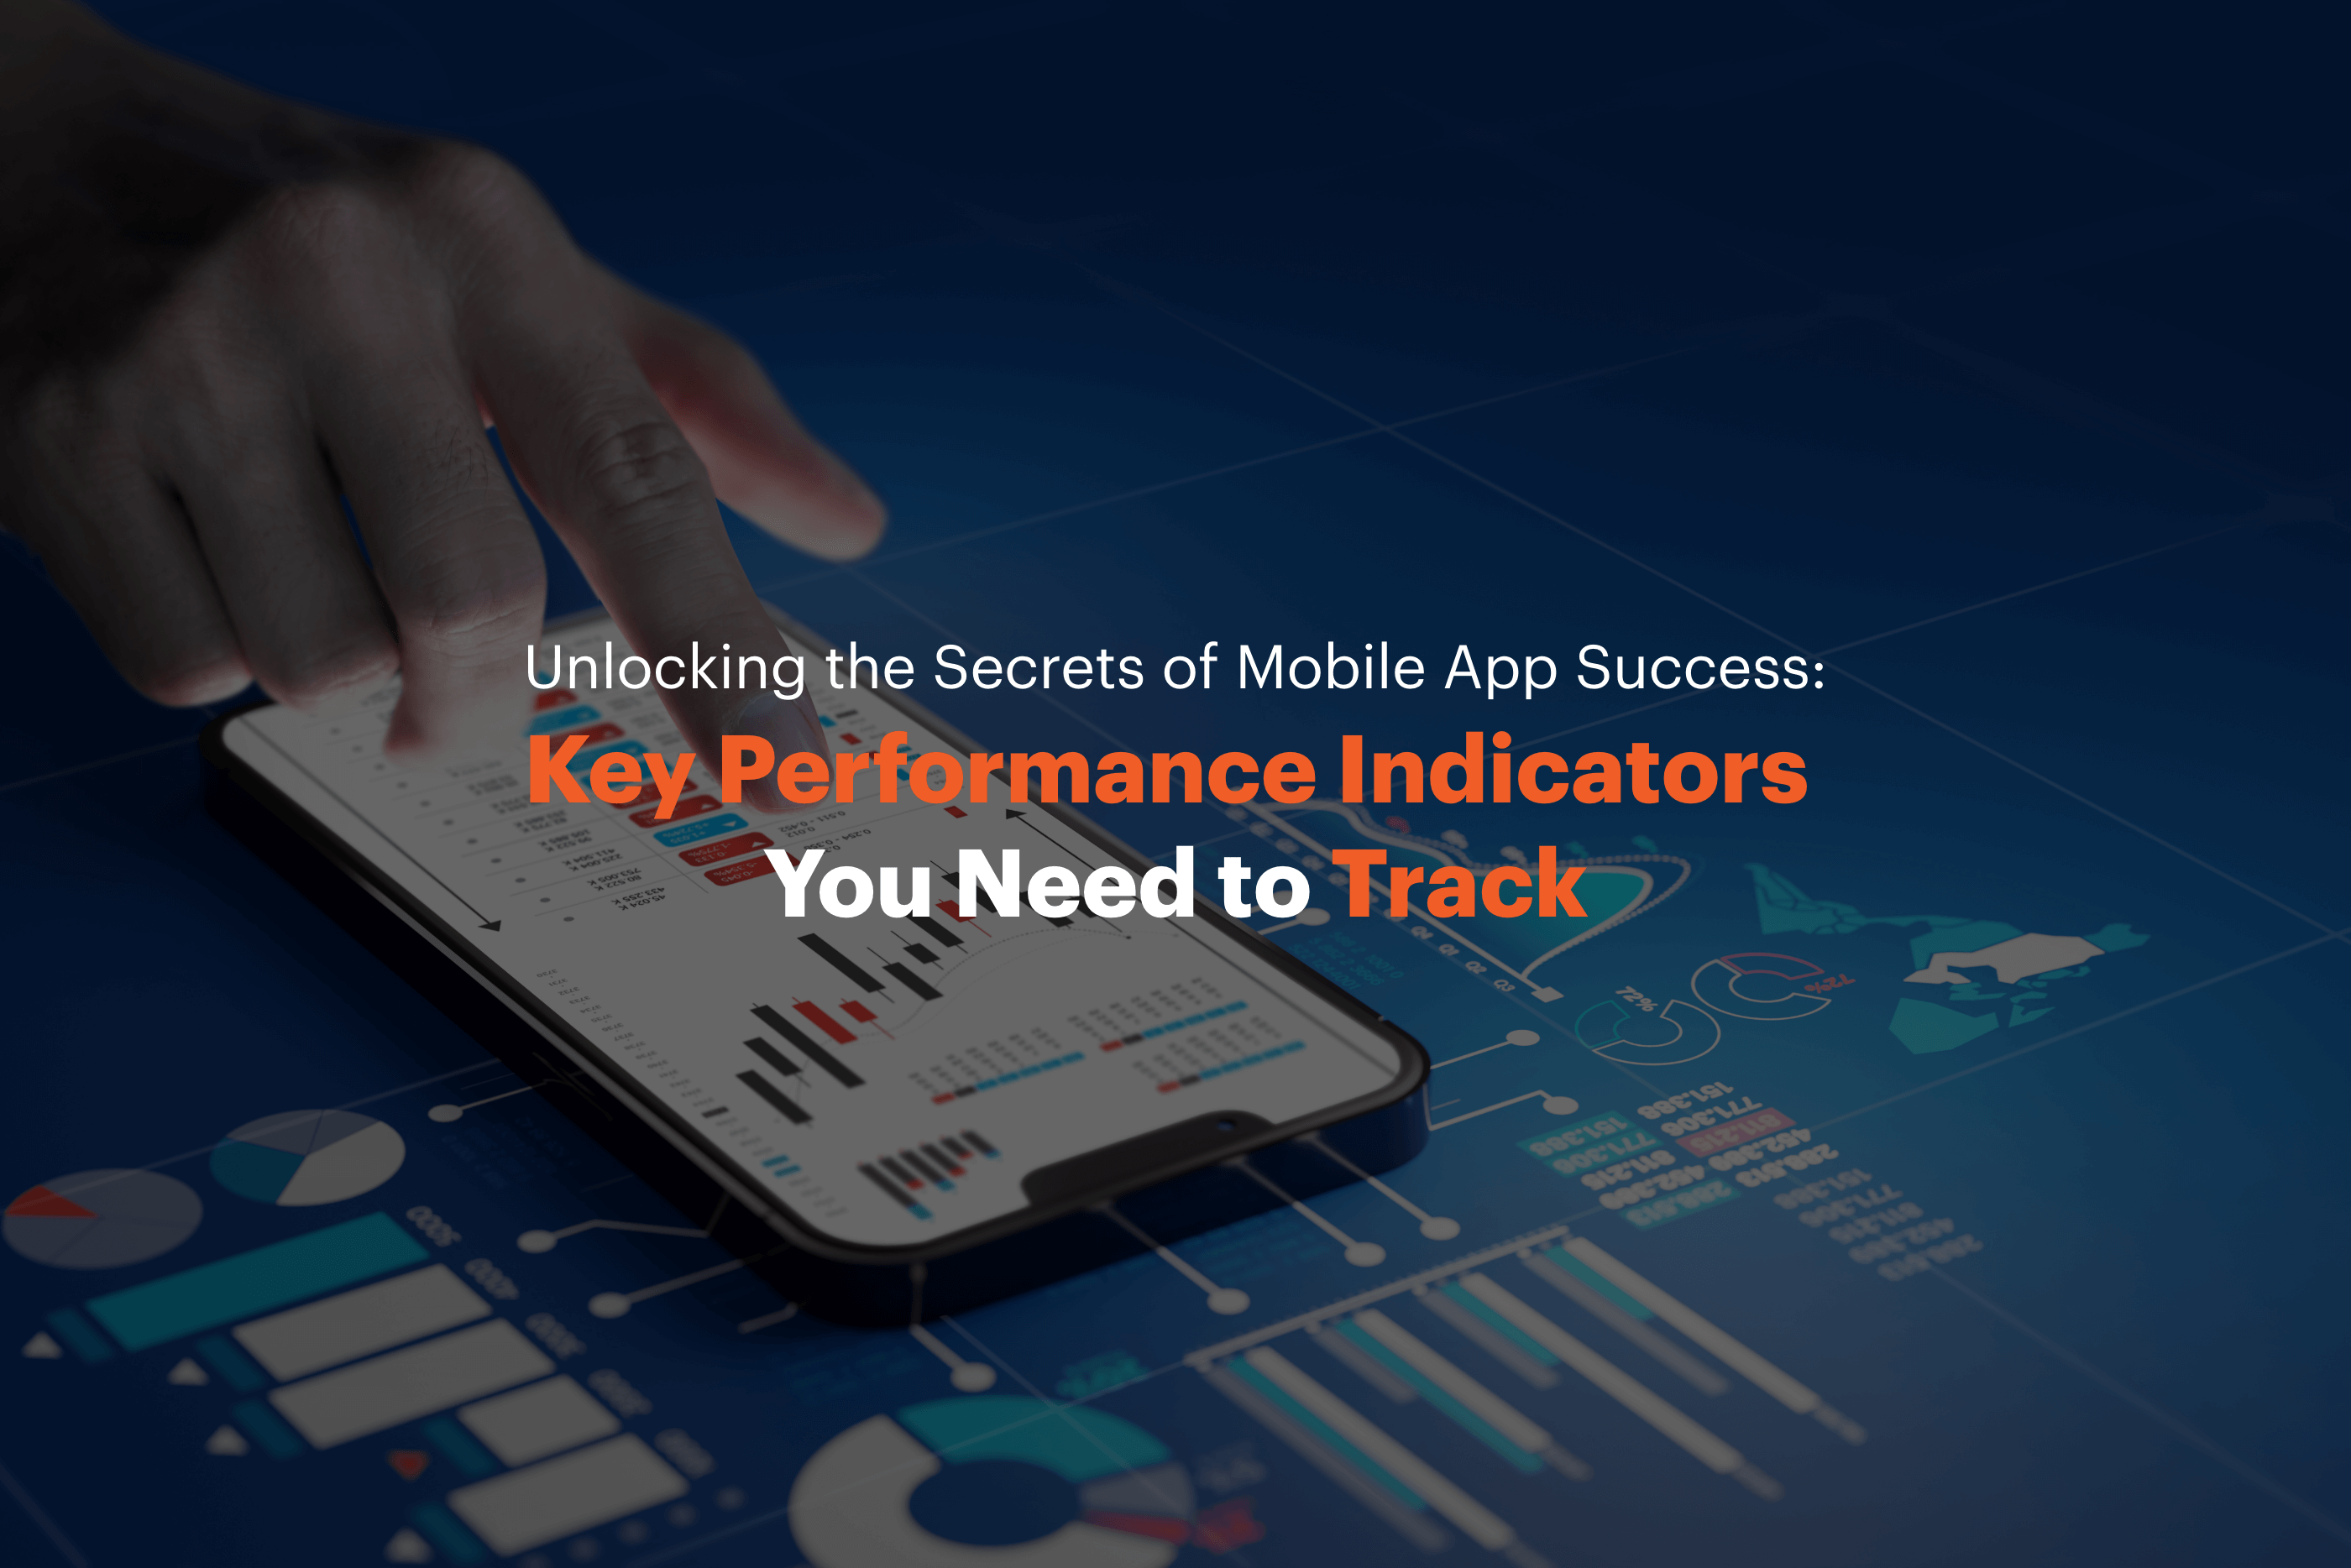
Mobile applications have become an integral part of our lives, with millions of people using them every day. However, creating a mobile app is just the beginning; its success is measured by its ability to engage users and achieve its objectives. To achieve this, tracking and measuring key performance indicators (KPIs) that indicate the app's success is essential. In this article, we will discuss some of the crucial KPIs that can be used to measure the success of your mobile app.
User Acquisition
User acquisition is a key performance indicator (KPI) that measures the number of new users who download and install your mobile app. This metric is essential because it shows how well your app is performing in the app stores and how successful your marketing efforts are in attracting new users.
To track user acquisition, you should monitor metrics such as app store ranking, organic downloads, paid investment, cost per install (CPI), and install-to-registration ratio. App store ranking is important because the higher your app ranks, the more visible it is to potential users and the more likely they are to download it. Organic downloads refer to the number of users who found and downloaded your app through non-paid channels such as social media, word-of-mouth, or app store searches. Paid acquisition measures the number of users who downloaded your app through paid channels such as advertisements or influencer marketing. CPI measures the amount you spend acquiring a new app user. Finally, the install-to-registration ratio measures the percentage of users who complete the registration process after installing your app.
By monitoring these user acquisition metrics, you can identify areas for improvement in your app store optimization and marketing strategy and optimize your app for better user acquisition. Remember that user acquisition is just one of several KPIs you should track to measure the success of your mobile app, and you should use it in conjunction with other KPIs to get a complete picture of your app's performance.
Retention rate
Retention rate is a key performance indicator (KPI) that measures the percentage of users who continue to use your mobile app after the initial download. It is an essential metric to track because it indicates users' long-term engagement and satisfaction with your app.
To track the retention rate, you should monitor metrics such as Day 1 retention, Week 1 retention, Month 1 retention, and churn rate. Day 1 retention measures the percentage of users who return to your app on the first day after installation, while Week 1 and Month 1 retention measure the percentage of users who return to your app within the first week and the first month after installation, respectively. The churn rate measures the percentage of users who stop using your app over a given period.
By monitoring these retention rate metrics, you can identify areas for improvement in your app's user experience, engagement, and value proposition. You can use this information to optimize your app for better retention and increase user satisfaction, engagement, and revenue. Remember that retention rate is just one of several KPIs you should track to measure the success of your mobile app, and you should use it in conjunction with other KPIs to get a complete picture of your app's performance.
Engagement rate
Engagement rate refers to the level of user activity within your app, and it's an essential metric because it indicates how frequently users interact with your app and how engaged they are with your app's features and content.
Key metrics to track under engagement rate:
Daily Active Users (DAU): This metric measures the number of unique users who use your app daily. It's an essential indicator of user engagement and app usage frequency.
Session Length: This metric measures users' average time on each app session. It's an essential indicator of user engagement and the depth of user activity within your app.
Screen Flow: This metric measures the sequence of screens users navigate through in your app. It's an essential indicator of user engagement and your app's user experience.
Retention Cohorts: This metric measures the engagement levels of user groups over a given period. It's an essential indicator of the long-term engagement and retention of users.
By monitoring these engagement rate metrics, you can identify areas for improvement in your app's user experience, features, and content and optimize your app for better user engagement. In addition, you can use this information to increase user satisfaction, retention, and revenue over time.
Conversion rate
Conversion rate refers to the percentage of users who take a specific action within your app, such as making a purchase, completing a registration, or subscribing to a service.
Key metrics to track under conversion rate:
Install-to-Signup Conversion Rate: This metric measures the percentage of users who sign up for your app after installing it. It's an essential indicator of your app's user experience and value proposition.
Install-to-Purchase Conversion Rate: This metric measures the percentage of users who purchase installing your app. It's an essential indicator of your app's user experience, value proposition, and revenue potential.
Cart Abandonment Rate: This metric measures the percentage of users who add items to their cart but still need to complete the purchase. It's an essential indicator of the user experience, the pricing strategy, and the checkout process of your app.
Subscription Conversion Rate: This metric measures the percentage of users subscribing to a service or product within your app. It's an essential indicator of your app's user experience, value proposition, and revenue potential.
By monitoring these conversion rate metrics, you can identify areas for improvement in your app's user experience, pricing, checkout process, and value proposition. You can use this information to optimize your app for better conversion rates and to increase revenue over time.
Revenue
Revenue refers to the total amount of money generated by your app over a given period, and it's an essential metric because it indicates your app's financial viability and profitability.
Key metrics to track under revenue:
Total Revenue: This metric measures the total amount of money generated by your app over a given period, including all sources of revenue, such as in-app purchases, subscriptions, ads, and sponsorships.
Average Revenue Per User (ARPU): This metric measures the average revenue generated by each user over a given period. It's an essential indicator of your app's revenue potential and profitability.
Lifetime Value (LTV): This metric measures the total revenue generated by each user over the entire lifetime of their usage of your app. It's an essential indicator of your app's long-term revenue potential and profitability.
Cost per Install (CPI): This metric measures the cost of acquiring each user who installs your app. It's an essential indicator of the cost-effectiveness and ROI of your user acquisition campaigns.
By monitoring these revenue metrics, you can identify areas for improvement in your app's revenue streams, pricing strategy, user retention, and user acquisition. You can use this information to optimize your app for better revenue and profitability over time.
App crashes
App crashes are a critical KPI to measure the success of your mobile app. It refers to the number of times your app unexpectedly stops or closes, causing an error and interrupting the user experience. Frequent app crashes can lead to poor user satisfaction and churn, negatively impacting your app's success.
The key metrics to track under-app crashes include crash rate, the average time to crash, and crash reports. The crash rate measures the percentage of sessions that resulted in an app crash, while the average time to crash measures the average time between app launches and crashes. Crash reports, on the other hand, measure the number and frequency of crash report users to generate.
By monitoring these app crash metrics, you can identify specific issues causing app crashes, improve the stability and reliability of your app, and enhance the overall user experience. In addition, you can use this information to optimize your app for better user engagement, satisfaction, and retention over time. It's important to note that app crashes are just one of several KPIs you should track to measure the success of your mobile app, and you should use it in conjunction with other KPIs to get a complete picture of your app's performance.
User Feedback
User feedback refers to the comments, ratings, and reviews users provide on app stores, social media, and other channels. User feedback provides valuable insights into user satisfaction, engagement, and retention, allowing you to identify areas for improvement and optimize your app accordingly.
The key metrics to track under user feedback include app ratings, reviews, and social media mentions. App ratings measure overall satisfaction, app reviews provide specific feedback on features or issues, and social media mentions provide insights into user sentiment and engagement.
By monitoring user feedback, you can identify areas for improvement, enhance the overall user experience, and improve user retention, revenue, and growth over time. User feedback can also help you make informed decisions about future updates and feature releases based on user needs and preferences.
Conclusion
Measuring the success of your mobile app is essential to ensure that it is meeting its objectives and engaging users. By tracking and measuring the key performance indicators discussed in this article, you can gain valuable insights into your app's performance and make data-driven decisions to improve it. Remember, the success of your app is not just about the number of downloads or revenue generated but also about user engagement and satisfaction.